I was asked by a reader about how I figure out the form_line_id assigned to elements on a form. There are a few ways, but this is probably the easiest and it provides a tool that can be used over and over again. However, since it does require writing a custom report, I figured I would use the opportunity to walk through designing a Data Insight report using a custom virtual view.
Step 1: Writing the SQL Query
Before we get to Data Insight, we need a query to use for our virtual view. The report that I want to create is going to need to include the name of the form field (caption) so that I know I am getting the right GUID. I want to filter on the form name so that I can more quickly find the right form and form field. And if your system is anything like mine, you have multiple forms with the same or similar names, possibly even across various form families. So I am also going to want to bring in the form codes and the form family information.
All of these items are stored in just 3 tables: form_family, form_header and form_lines.
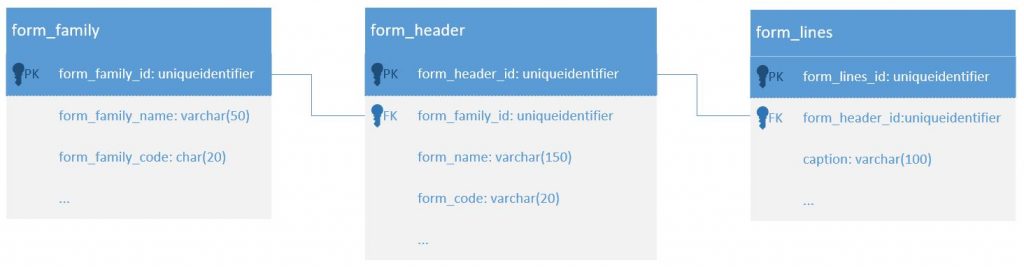
The form_header table holds information about each form. Each form_line belongs to a single form_header and gets a unique form_line_id per form that it is on. In other words, even if you have actual_date on all of your forms, each actual_date element has a different form_line_id for each form it is on. Also be aware that if you remove a form element form a form and re-add it to the same form, it will be assigned a new form_line_id when it is re-added.
Forms (form_headers) belong to a single form_family and so they have a form_family_id. Similar to the above statements about form_lines, if you delete a form in the form designer and then recreate it, it will have a new form_header_id. If you import a form from development into your production system, myEvolv is going to give your form and all of the form_lines (elements) therein a new id as part of the import process. Once your production is later copied over to development, that imported form’s elements and header will have matching ids.
So here’s the SQL query we will use for this report:
SELECT
form_family.form_family_name,
form_family.form_family_code,
form_header.form_name,
form_header.form_code,
form_lines.caption,
form_lines.form_lines_id AS nx_friendly_form_lines_id,
UPPER(form_lines.form_lines_id) AS classic_friendly_form_lines_id
FROM form_family
JOIN form_header ON form_header.form_family_id = form_family.form_family_id
JOIN form_lines ON form_lines.form_header_id = form_header.form_header_id
You will notice that I selected the form_lines_id column twice and that in on one of them, I used the UPPER() SQL function. GUIDs are returned from myEvolv in lower case format like this:
494eed56-36fb-4fda-b54f-a86f1d150b38
These work fine in your JavaScript for NX, but if you are working in classic, your JavaScript requires the GUIDs to be in upper-case so the UPPER() function takes care of that for you and returns that same GUID like this:
494EED56-36FB-4FDA-B54F-A86F1D150B38
This query will provide you with both options and you can choose to use one or both on the final report.
Step 2: Create Data Insight Virtual View
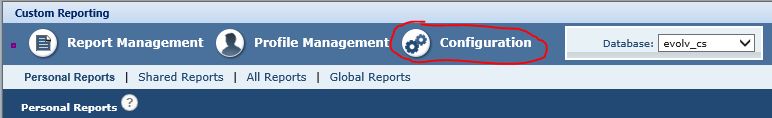
Now to Data Insight to create the virtual view we will use to create the report. In order to add or manage a virtual view in Data Insight, you must be assigned to a role with “Access Configuration Area” in Data Insight. If you haven’t played with Data Insight roles at all, then this is the same as saying you must be an Admin in Data Insight. if you have the proper permissions, you will see the “Configuration” option in your Data Insight menu.
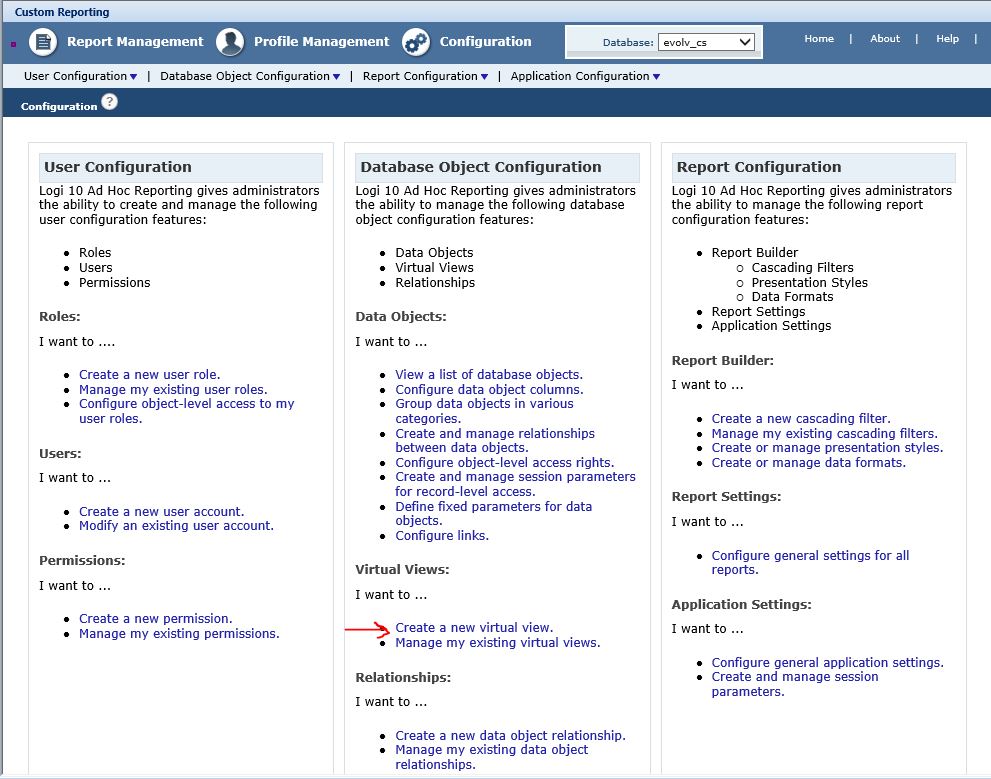
Click the “Configuration” option and then in the center column, under “Database Object Configuration”, click the hyperlink for “Create a new virtual view.”
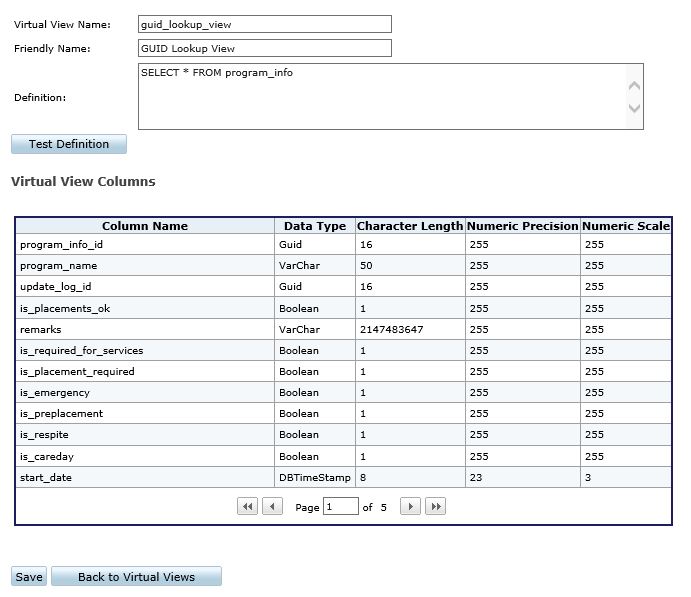
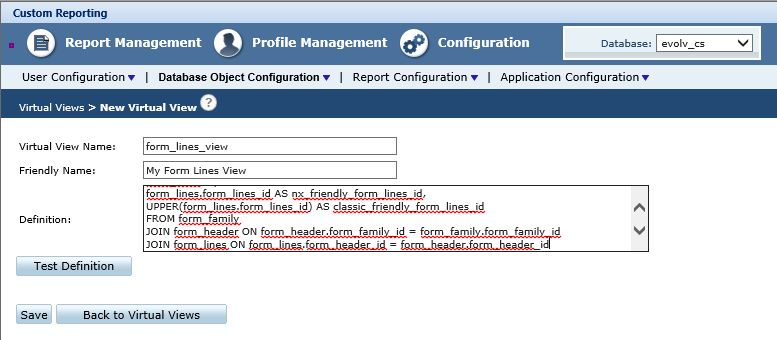
Give your new virtual view a name and a friendly name. The name must be letters, numbers and underscores. The friendly name can have spaces.
Copy and paste your query into the Definition field and then click the “Test Definition” button. You can ignore the red underlining here since that is just Internet Explorer’s spell check at work. It does not indicate that the SQL is malformed.
If your query is valid SQL, you should see a list of the selected columns from your query appear. If not, you may have errors in your SQL to fix.
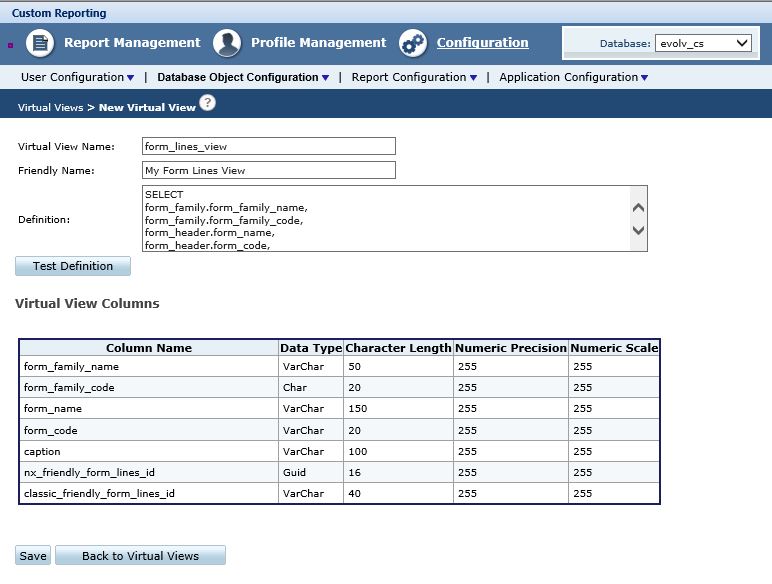
Once you have a query that passes the test, click “Save” to save that virtual view.
Step 3) Create Data Insight Report
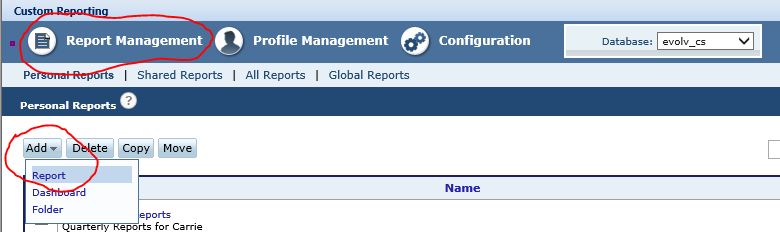
Navigate to the Report Writing area of Data Insight by clicking the “Report Management” option in the top menu. Then click “Add” and select “Report” from the drop down menu.
Select a “Tabular Report with Header” from the Report Template options and click “OK”
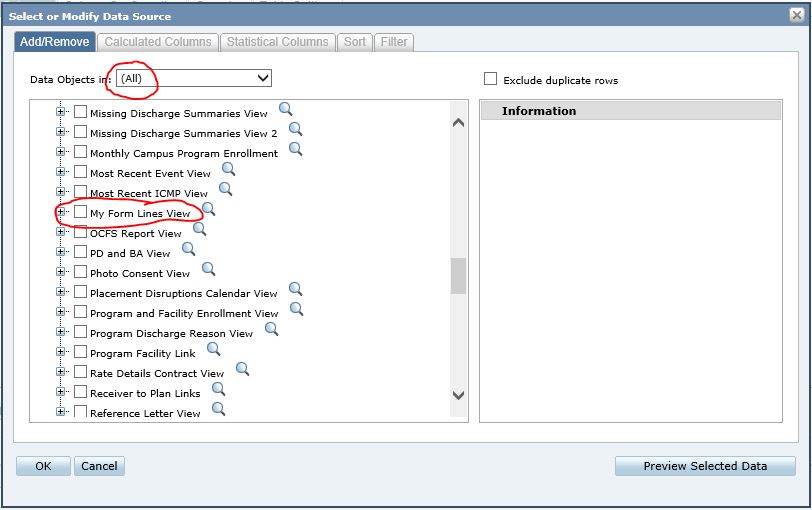
When the Data Source pop-up window appears, make sure the “Data Objects in:” drop down menu has “(All)” selected. Then check the box next to your virtual view to select it and then click “OK”.
Since the data we are looking at includes 3 tiers of information– Form Families that contain Form Headers (forms) that contain Form Lines (elements), it makes sense to ad some groupings so we can see more easily what all belongs to what.
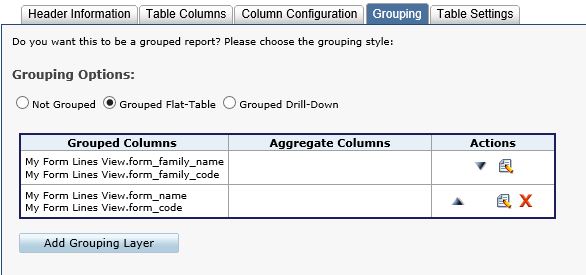
Click the “Grouping Tab”, select the “Grouped Flat-Table” radio button and then click the “Add Grouping Layer” button.
On your first layer, add the form_family_name and form_family_code field and click “OK”.
Click the “Add Grouping Layer” button again to create the next grouping. For this grouping add the form_name and form_code fields and then click “OK”. When this step is done, you should have a grouping screen that looks like this:
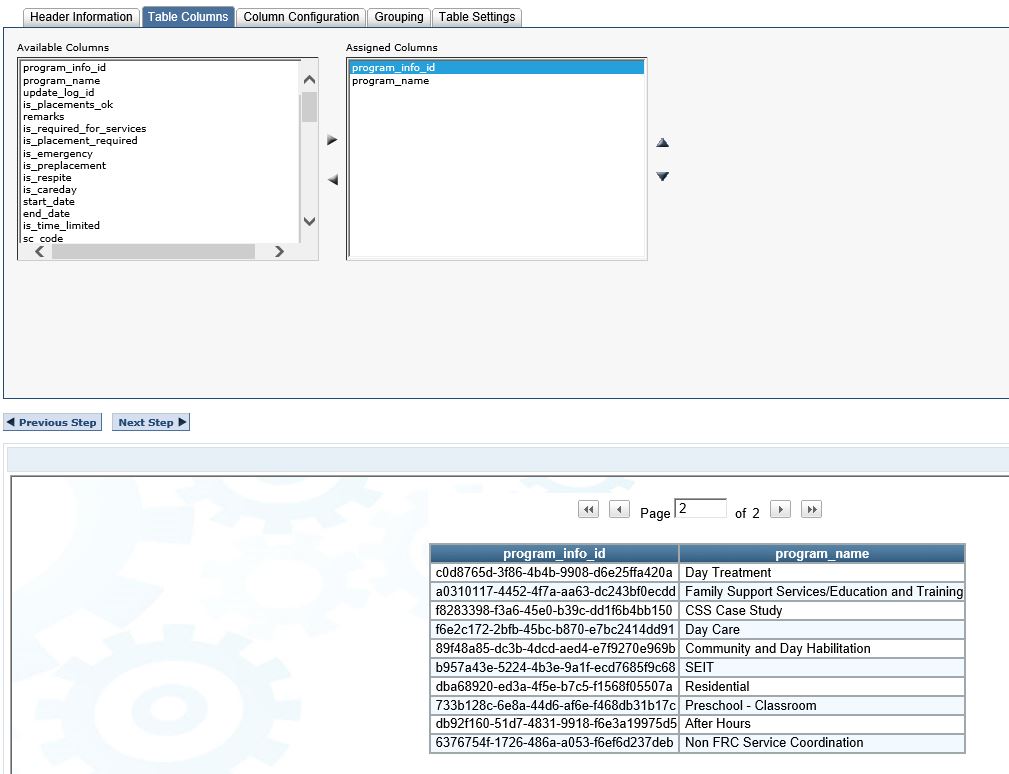
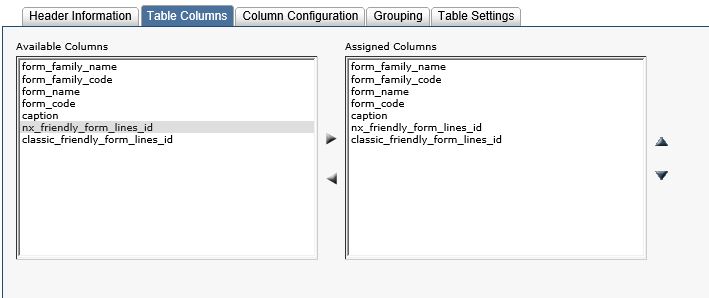
Go back to the “Table Columns” tab and add caption, nx_friendly_form_lines_id and classic_friendly_form_lines_id to the “Assigned Columns” list. It should look like this:
Your report preview pane at the bottom should spit out a report that includes every form line in every form in every form family in your system. It probably takes a while to load. We don’t want such an unwieldy report so we will add a filter on the form name by clicking “Modify Data Source” on the left side of the preview.
PRO TIP: Hiding the Live Preview is a good idea if you have a report that runs very slowly to avoid having to wait for the report to complete upon each change made to the report.
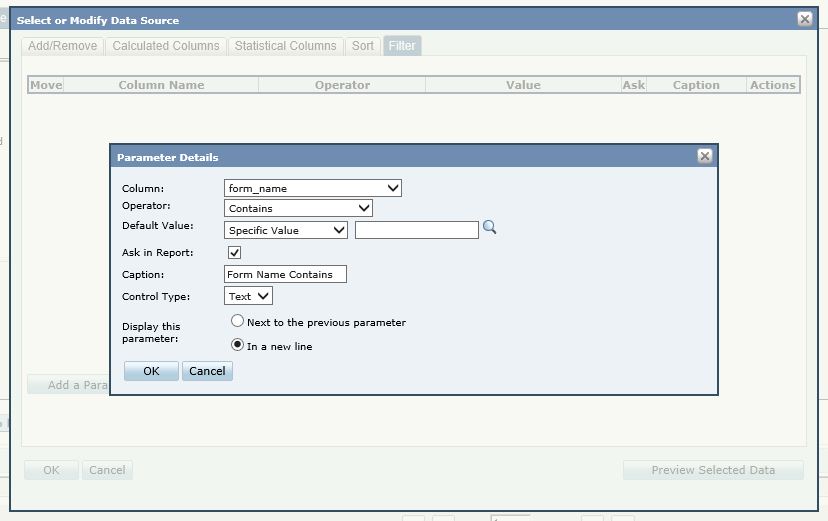
In the pop-up window, click to view the “Filter” tab and then click “Add a Parameter”. Select the column form_name. Change the operator value to “Contains” and check the “Ask in Report” checkbox. Make a caption for your parameter prompt and then click “OK” to close the parameter details popup and then “OK” again to close the data source details popup.
Your live preview pane should now be blank but prompting you to enter a form name (or part of one). Test your report by searching for one of your forms.
You should see something like this in the results:
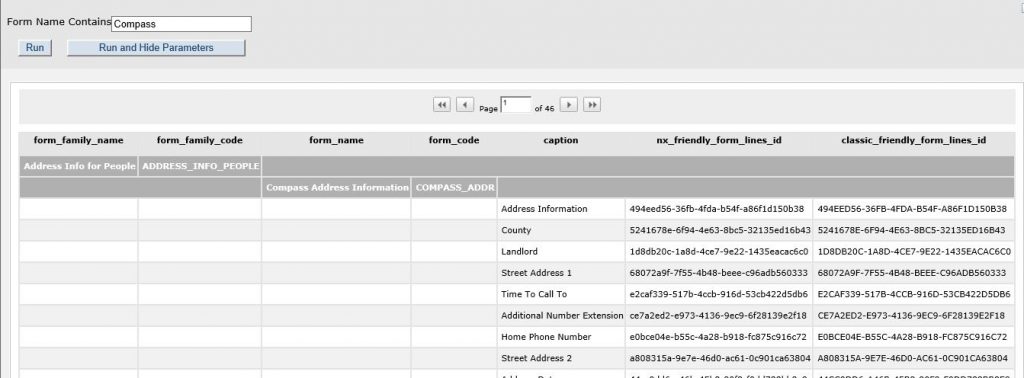
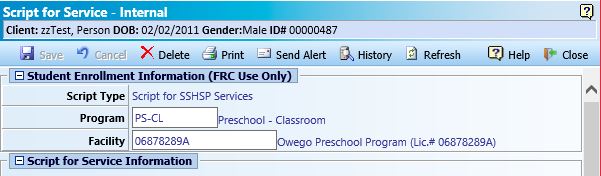
The first result in my report searching for “Compass” is for form lines on the Compass Address Information form in the Address Info for People form family. If I look at the form in form designer, I will see all of the same elements listed. Keep in mind the groups are also form elements and therefore are include on the form_lines_id. That is what “Address Information” is on the Compass Address Information form.

At this point, you can make the report look and work to your liking by changing the column captions, adding sorting, removing pagination, etc. Be sure to save your report and move or copy it from your personal reports folder to the Shared Reports if you want to allow others to use the report too.