There are times when it is useful to analyze the Document Object Model of your myEvolv form, especially when you are trying to figure out ways of manipulating the form with JavaScript. If you are on a main screen in myEvolv, you can simply press the F12 key on your keyboard to bring up Internet Explorer’s developer tools. However, this does not work when you press it while focused on a modal pop-up in myEvolv.
In order to get the developer tools to work so that you can see the DOM for your event forms, follow the steps below.
1) Disable Setting that Allows Websites to Suppress Address Bar
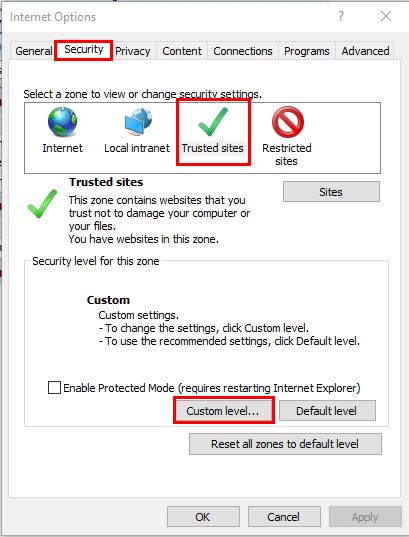
Open Internet Explorer’s Internet Options and click on the “Security” tab. Make sure “Trusted Sites” is highlighted and click the “Custom level…” button.
In the Security Settings dialog, scroll down to the Miscellaneous settings. Select “Disable” for the setting “Allow websites to open windows without address or status bars”. Apply the settings and close the Internet Options dialog.
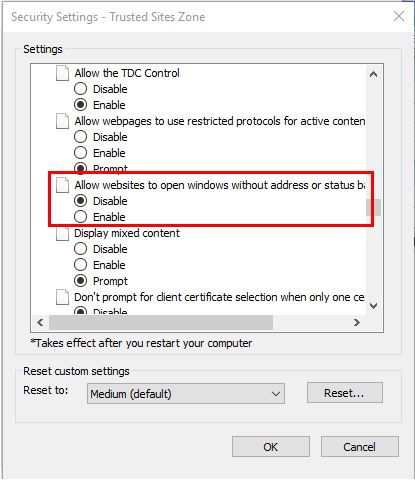
This setting will cause the modal popups that myEvolv uses to display event forms to display their url, which is required for developer tools to be used on a window.
2) Open Developer Tools and Un-Pin it From the Browser Window
At this point, some of you may be able to simply open an event form in myEvolv and press F12 and the developer tools open without problem. For others, nothing happens when F12 is pressed in a modal or you get a warning that says the main windows developer tools will need to close so that i can open a new one in the modal but then nothing happens.. The rest of the steps in this post will show the workaround for that.
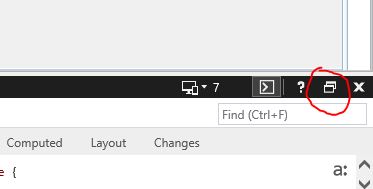
The first thing you will need to do is un-pin the developer tools from the browser window so that they open in their own separate window. Close any modals you have open and press F12 so that the developer tools open in the browser. In the upper right hand corner of the development tools pane, there is an un-pin button you can click. The develop tools will then open in their own separate window.
3) Open The Event and Select the Right Form in the Debugger
With the Developer tools in their own window, you can open the event that you want to analyze with developer tools and still have access to the developer tools window. When you open the event, it will not automatically populate in the developer tools. You must select it in the “Debugger” tab.
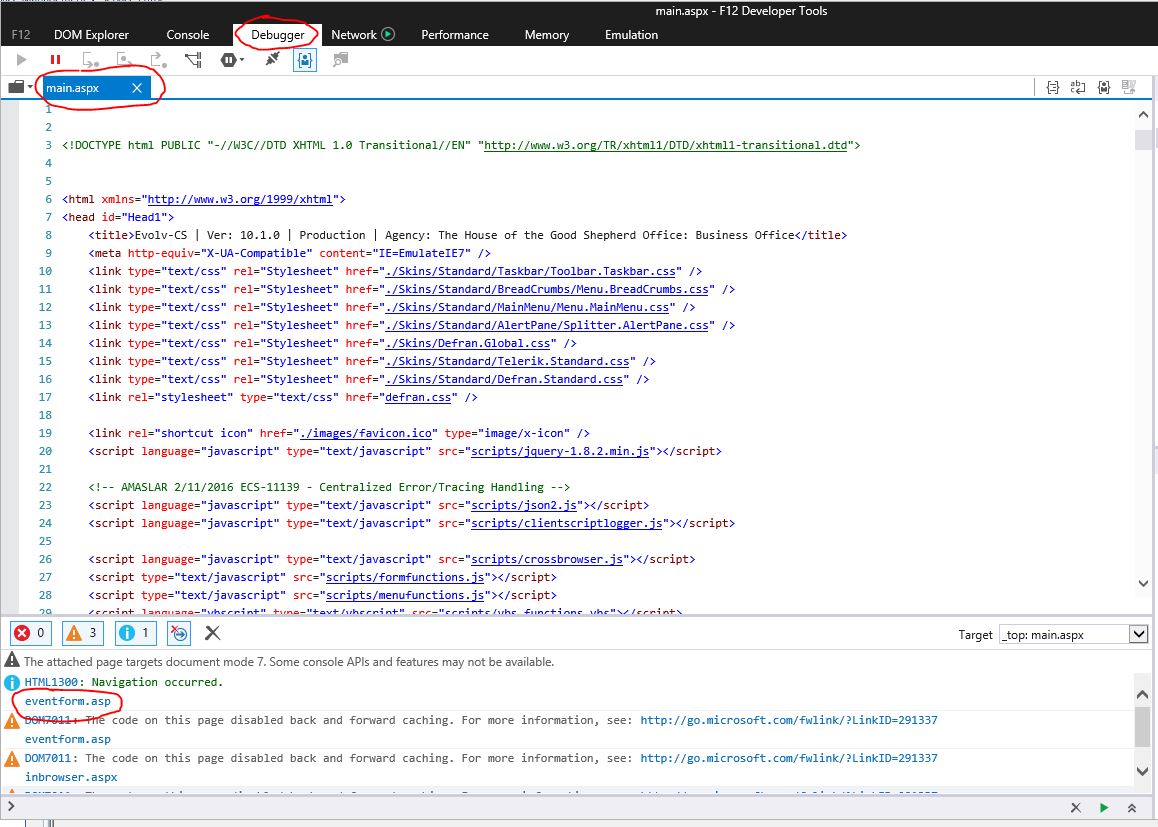
Click the Debugger tab and note that the pane below the toolbar support multiple tabs. You will probably see main.aspx loaded in the pain and that represents the main screen of myEvolv. At the bottom of that pane is a debugger pane. Find an error or warning related to eventform.asp. It should be shown as a link and clicking that link will load the event_form DOM in the debugging pain next to main.aspx.
UPDATE: Easier Way
Instead of going through the last steps 2 & 3 above, you can just copy and paste the url for the modal into a new tab in Internet Explorer and then launch developer tools for that tab.